Summary:
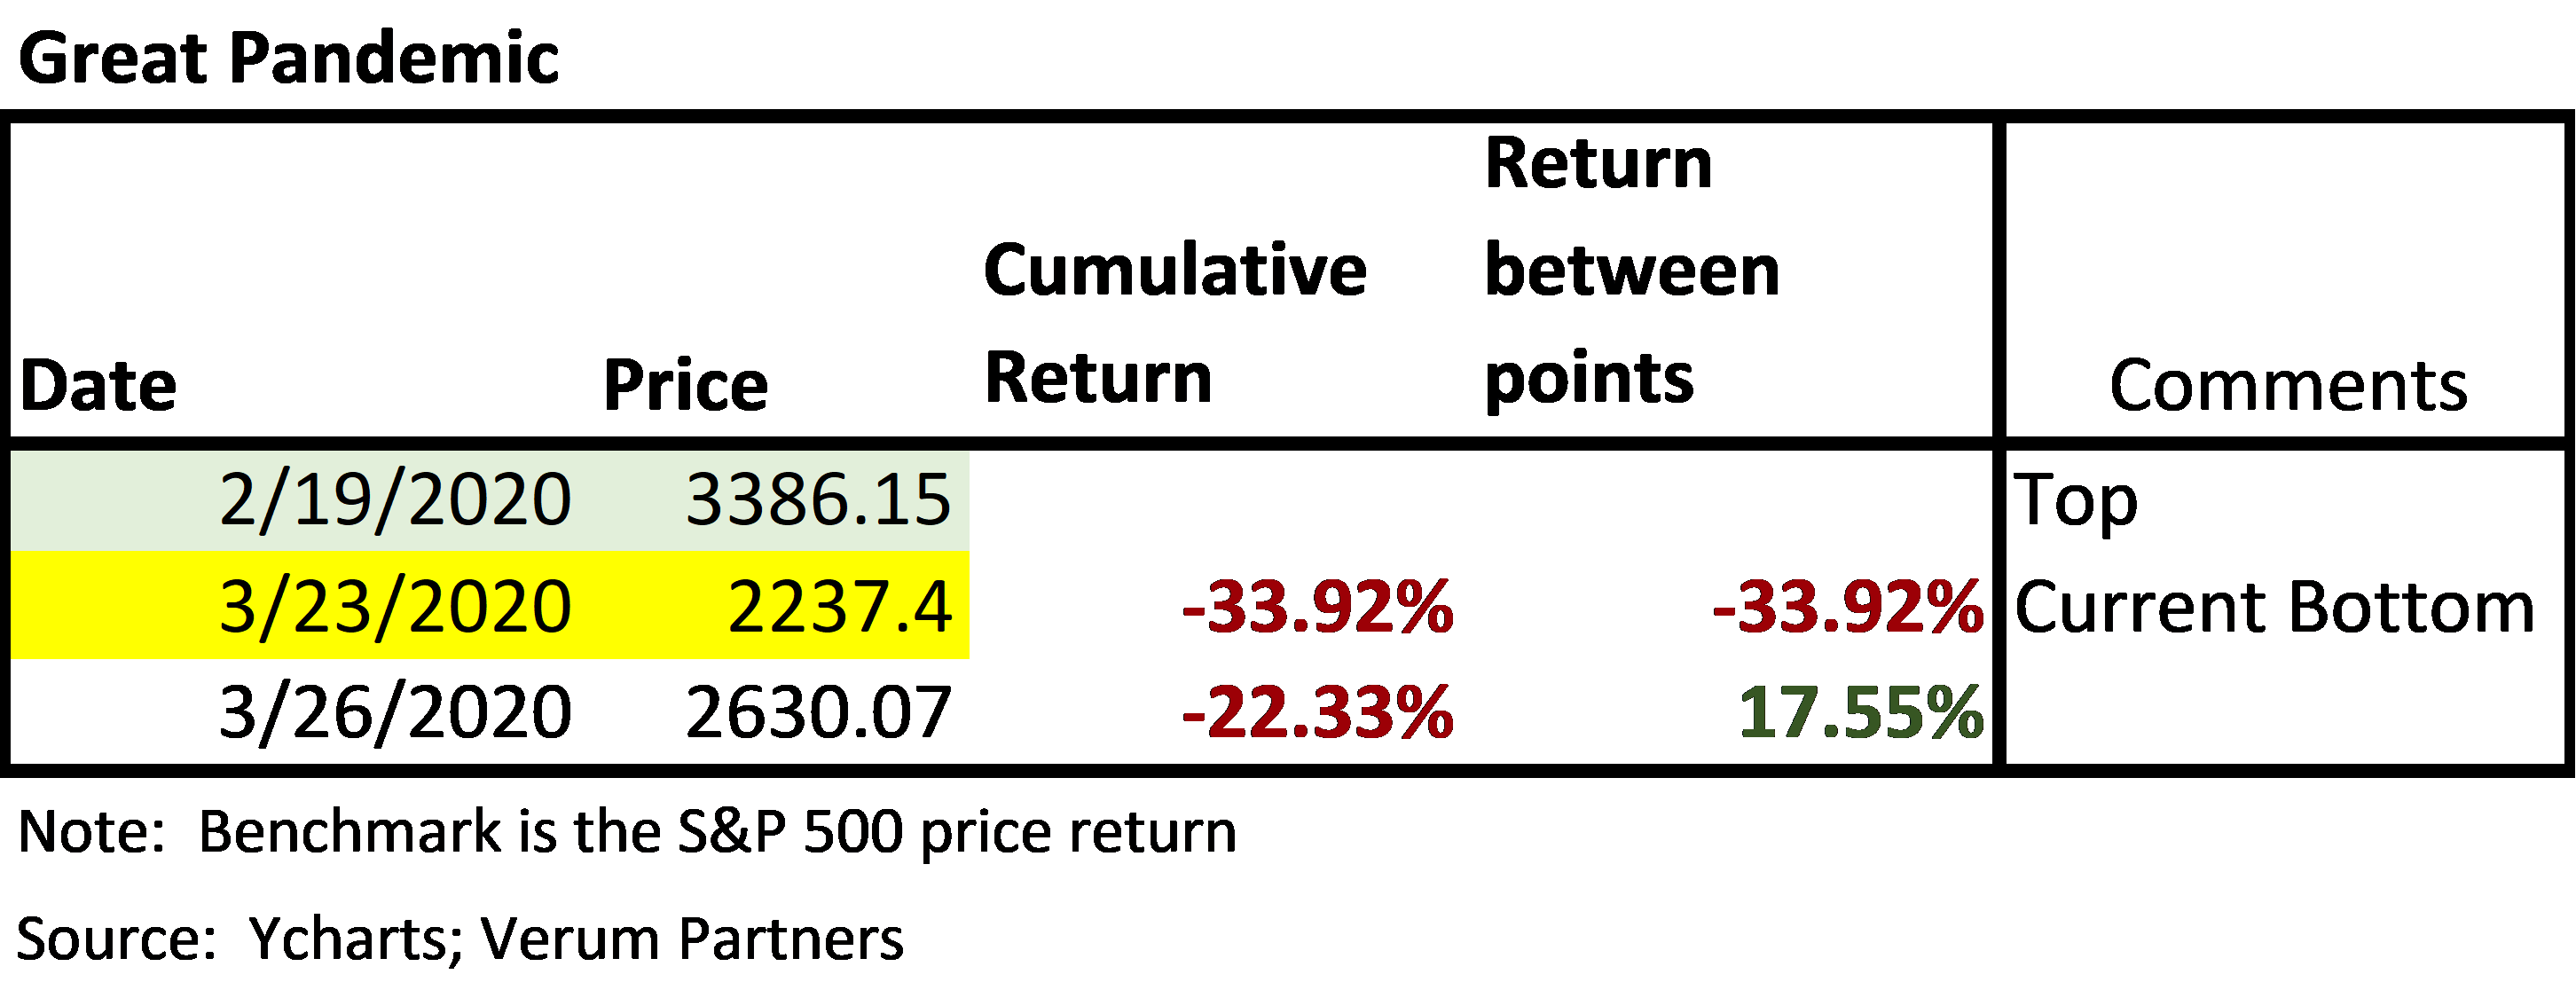
- The Great Pandemic bear market was the fastest 10%, 20%, and 30% market downturn from an all-time high in market history.
- Last week’s three-day rally was historic on many fronts. It was one of the fastest and strongest rallies we have ever seen.
- When past bear markets are analyzed we observe that all bear markets have strong rallies, but most have not seen the speed and strength of such a rally this early into the bear market. The recent rally was stronger than any bear market rally from the 2008 or 2000 bear markets.
- 1987’s crash offers the most parallels to the Great Pandemic but given 1987’s lack of economic destruction relative to the pandemic, we question whether it’s truly a blueprint.
- The 1929 crash does have some similarities in price action. However, for a variety of reasons we believe comparisons to 1929 are unfounded and ignore a variety of key underlying fundamental economic drivers and government responses.
- We ultimately don’t know if we have put in a market bottom. We suspect that we will continue to see historically elevated volatility for the coming weeks and could likely test the recent bottom or make new bottoms as markets come to grips with the economic shutdown.
- While this rally is more likely to end up being a bear market rally than a bull market, investors should use last week as a reminder that the best days often immediately follow the worst days. Trying to time markets during these periods is nearly impossible. Selling during the pain to sit out a few hands could be utterly destructive to your wealth.
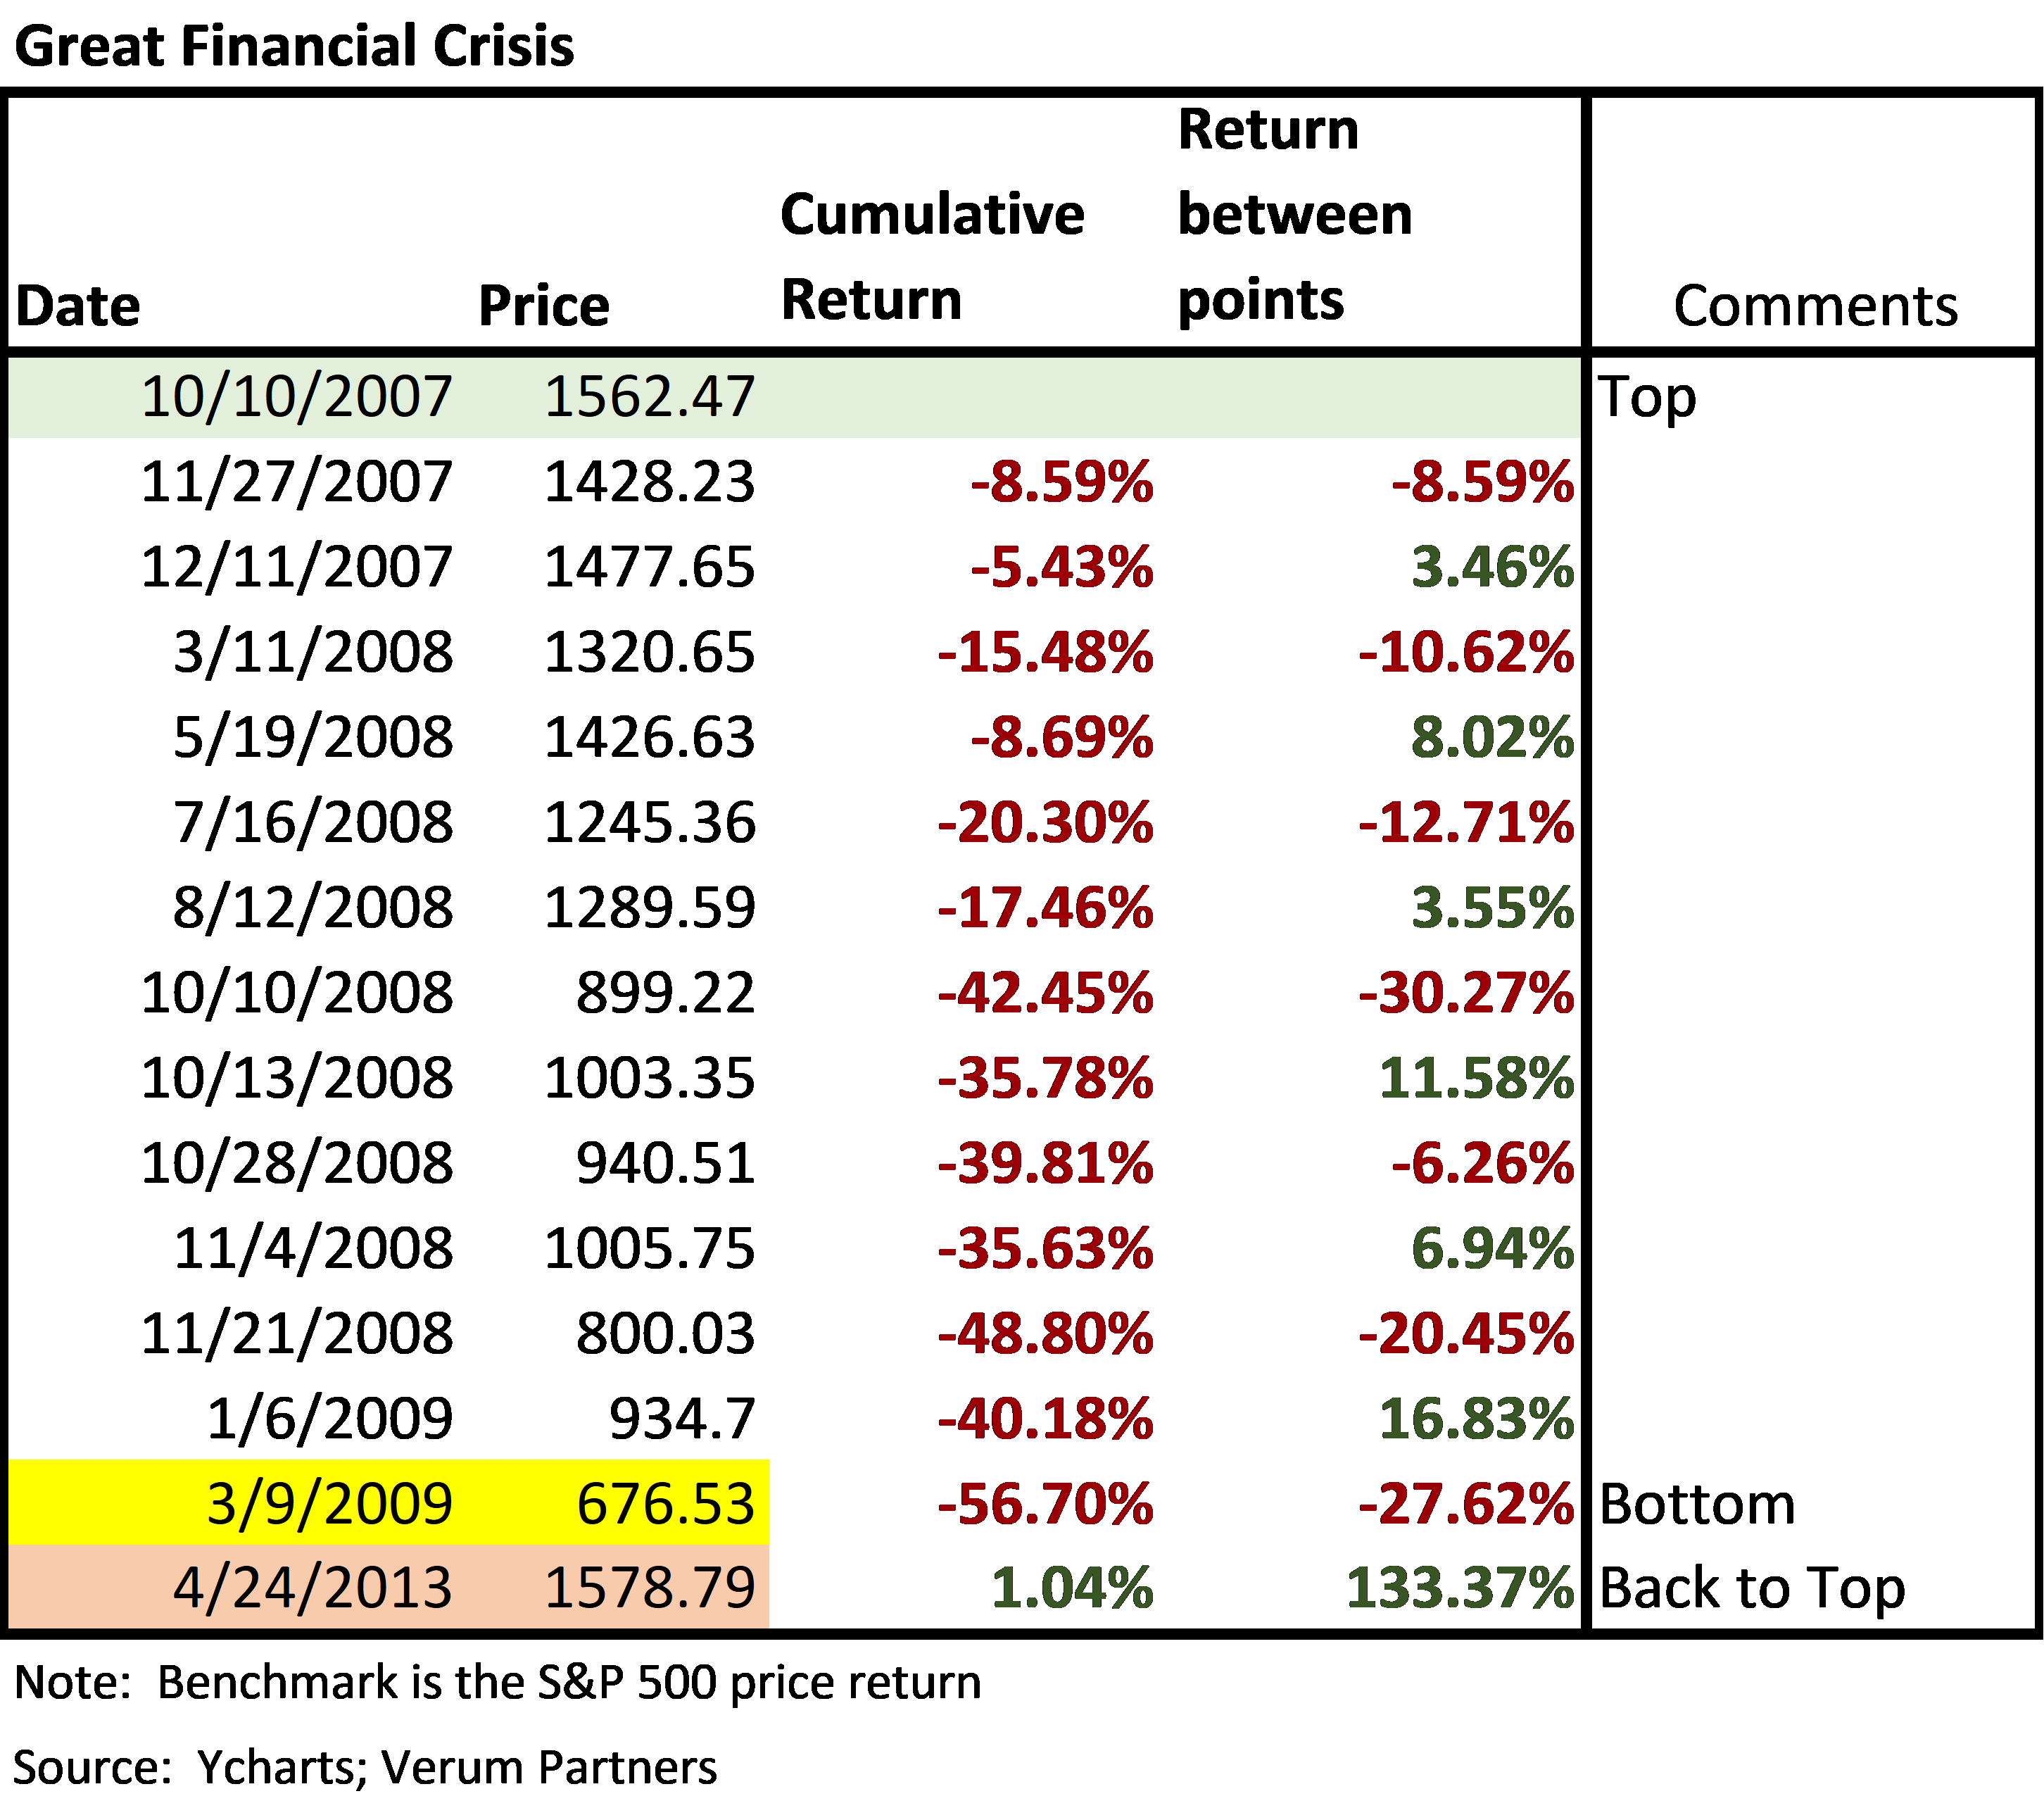
The financial crisis saw six notable “bear market rallies.” Two of those represented double digit rallies. The 11.5% rally happened in just three days after the Lehman Brothers collapse and the second was the last bear market rally that lasted for approximately 6 weeks over the holidays of 2008. While there are clear similarities to last week’s price action, neither rally stacks up in terms of both speed and return as last week’s rally.
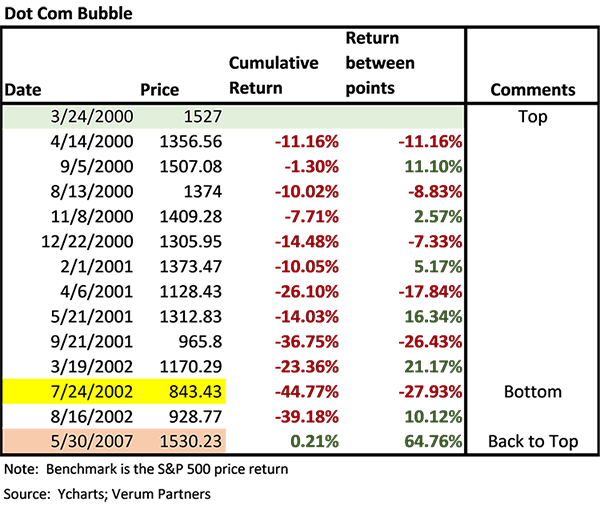
When we examined the Dot Com Bubble collapse, we see that while there were intensely positive rallies during the bear market, most of them took weeks, if not many months, to play out. While market prices and momentum resembled the Dot Com Bubble coming into the Great Pandemic, the bear markets look nothing alike. Here is the data:
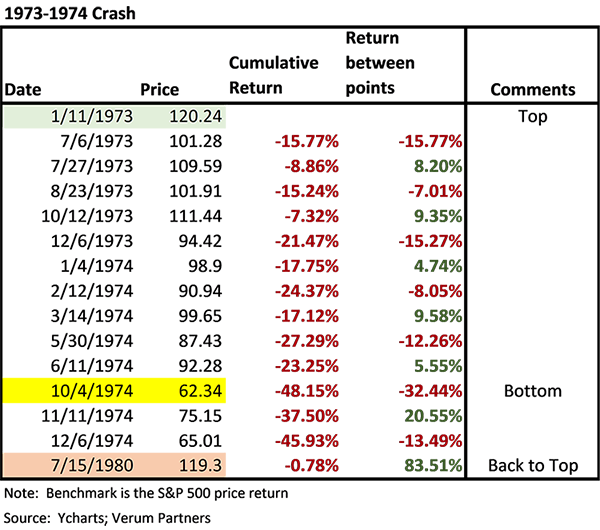
Sticking with the theme of brutally bad bear markets, I also examined the 1973-1974 bear market. This bear market is one of the worst of all time, but amazingly history often glosses over just how bad the market was. While the market ultimately fell by 48% from January 1973-October 1974, we see no double-digit rallies during this period. There was an incredibly strong rally after the bottom was found between October 4, 1974 and November 11, 1974 of 20.5%, though.
Of all the bear markets experienced since the Great Depression, none look as similar to the Great Pandemic crash of 2020 as the 1987 market crash. Here is the price action:
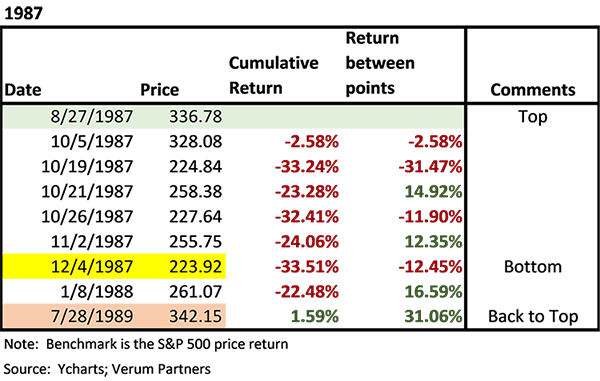
From October 5th, 1987 through October 19th, 1987 the market collapsed 31% (and was already down 2.5%). In just two days, the market then rallied almost 15%. The market would then go on to see two more legs down to effectively retest the October 19th lows on December 4th. Prior to the recent event, 1987 was without a doubt the fastest and steepest fall that most living investors could recall. In looking at the early price action there has been a very similar pattern. In 1987, the first big rally effectively represented the bottom.
While 1987 seems to be the closest blueprint to the Great Pandemic, it’s worth noting that 1987’s collapse was largely driven by technical factors rather than external factors. This time around, we can clearly see the cause of the market collapse. We also know that halting the global economy will come with extreme pain economically. The ramifications of shutting down the economy are wholly unpredictable. We are simply in uncharted waters.
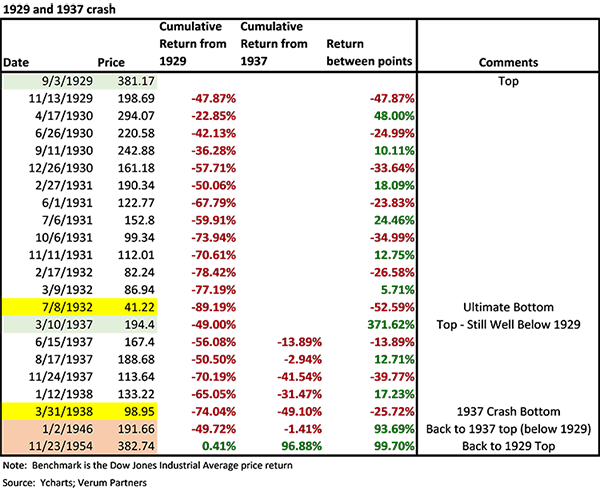
We are also aware that some have made comparisons to the Great Depression. In an attempt at intellectual honesty, we tried to create a similar analysis for the 1929 and 1937 crashes. We used Dow Jones Industrial pricing data rather than S&P 500 due to our access to the historical data. Here is the data:
The information provided is for educational and informational purposes only and does not constitute investment advice and it should not be relied on as such. It should not be considered a solicitation to buy or an offer to sell a security. It does not take into account any investor’s particular investment objectives, strategies, tax status or investment horizon. You should consult your attorney or tax advisor. The views expressed in this commentary are subject to change based on market and other conditions. These documents may contain certain statements that may be deemed forward looking statements. Please note that any such statements are not guarantees of any future performance and actual results or developments may differ materially from those projected. Any projections, market outlooks, or estimates are based upon certain assumptions and should not be construed as indicative of actual events that will occur. For additional information, please visit: https://verumpartnership.com/disclosures/