Fixed Income and the Terrible, Horrible, No Good, Very Bad Year
Much ink has been spilled about how bad of a year 2022 is for investors. Daily alerts from CNBC, Bloomberg, and the Wall Street Journal ping our phones – reminders that this is one of the worst years for balanced stock/bond portfolios ever. As of this writing, stocks (S&P 500) are down nearly 24% from their January 3rd highs. Meanwhile, a basic 60% stocks and 40% bonds index (U.S. Aggregate Bond Index) is down nearly 20%. Over the last few downturns, bonds have served as a great diversifier for stock market investors. They helped dampen volatility and they have historically appreciated or stayed steady when stocks fall. This intuitively makes sense as scared investors leave the stock market seeking, instead, the safety and security of U.S. Treasury bonds and bonds with similar characteristics (low default risk). 2022 is breaking the mold. Bonds and stocks have fallen in unison this year. One must go back to the 1970s to see a persistent trend where stocks and bonds were falling together.
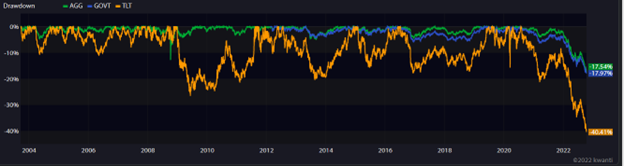
While much has been made of this horrible, no good, very bad year, the rise in interest rates and subsequent losses in the bond market cannot be overstated. Nearly every fixed income instrument has a negative return for the year. Most fixed income indexes have posted quite negative returns. With a starting yield of 1% to 3% for most indexes at the beginning of 2022, fixed income investors have lost multiple years of returns in a very short period. Below is a chart showing drawdowns for fixed income indexes since the 2004 downturns:
09/23/2003 – 10/14/2022
Source: Kwanti
Note: Ticker “AGG” represents the iShares Core US Aggregate Bond ETF which attempts to track the performance of the Bloomberg US Aggregate Bond Index. Ticker “GOVT” represents the iShares US Treasury Bond ETF. The ETF attempts to replicate the performance of the ICE US Treasury Bond Index. Ticker “TLT” represents the iShares 20+ Year Treasury Bond ETF and attempts to replicate the ICE US Treasury 20+ Year Bond Index.
To put into context the magnitude of the fixed income losses, it is worth looking at expected losses (or drawdowns) based on the volatility of an asset class. In examining 50-day annualized volatility for the Bloomberg U.S. Aggregate Bond index since 2004, most periods have experienced volatility around 2.5% to 4%. Using these levels of volatility, we could construct a basic confidence interval and suggest that there is a 99% chance that any one-year return for the index would be better than -12% (using the 4% standard deviation). Yet, the index has returned -15.8% in just ten months. We are approaching a 4 to 5 standard deviation event. By contrast, a 3 standard deviation drawdown for the S&P 500 would be 45%. We have exceeded this level of drawdown just three times (Great Depression, Global Financial Crisis, and dotcom bubble/September 11 terrorist attacks).
Not all fixed income has experienced such a strong drawdown. Bond returns are generally explained by two factors: either interest rate movements or changes in the appetite for credit/default risk (the risk you get your principal back from the bond-issuer borrower).
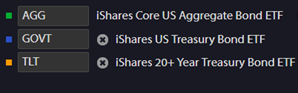
While this drawdown has generated negative returns across all fixed income markets, bonds that are more sensitive to interest rate movements have been punished more severely than bonds with sensitivity to credit/default risk. The chart below shows the year-to-date performance of short-term U.S. Treasury bonds as compared to long-term U.S. Treasury bonds. Short-term bonds have outperformed long-term bonds by more than 27% in ten months!
01/01/2022 – 10/14/2022
Source: Kwanti
Note: Ticker “GOVT” represents the iShares US Treasury Bond ETF. The ETF attempts to replicate the performance of the ICE US Treasury Bond Index. Ticker “TLT” represents the iShares 20+ Year Treasury Bond ETF and attempts to replicate the ICE US Treasury 20+ Year Bond Index. Ticker “VGSH” represents the Vanguard Short-Term Treasury ETF which replicates the Bloomberg US Treasury 1-3 year Bond Index.
Similarly, the market has punished bonds with less exposure to default risks more than one would expect. Historically, bonds with low default risk and high interest rate risk, such as U.S. Treasury bonds, have performed well during equity market dislocation. A bear market in stocks is typically accompanied by shrinking economic activity, lower earnings/profits, and higher financing costs for businesses. In such an environment, investors seek the safety of lower default risk while exiting investments that carry higher risk. This tends to increase the cost of borrowing for risky issuers (higher interest rates) while lowering the cost of borrowing for bonds with little default risk (government bonds).
To sum this up more succinctly, bonds with higher credit/default risk will typically fall with the stock market during a recession or dislocation. Their prices fall due to the rising risk that investors might not get their money back. At the same time, bonds with little or no credit/default risk may go up in value due to lower interest rates from the Fed or market forces.
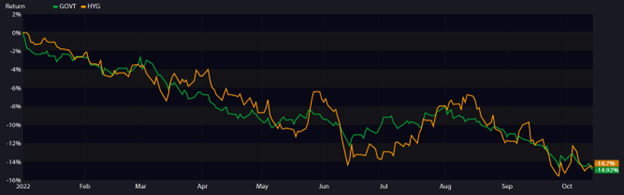
2022 has not been a normal year. Credit/default risk has not been the driver of lower returns in fixed income markets. Here is a chart of year-to-date performance for the U.S. Treasury market compared to below investment grade (high yield) bonds:
01/01/2022 – 10/14/2022
![]()
Source: Kwanti
Note: Ticker “GOVT” represents the iShares US Treasury Bond ETF. The ETF attempts to replicate the performance of the ICE US Treasury Bond Index. Ticker “HYG” represents the iShares iBoxx $ High Yield Corporate Bond ETF and attempts to replicate the Markit iBoxx US Liquid High Yield Index.
The riskiest bonds in the bond market have generally had a similar performance in 2022 to the “safest” bonds. The green line provides safety with respect to default risk while the orange line provides meaningful default risk. Importantly, the high yield index has lower interest rate risk than the government index. As rates have risen, bonds with higher interest rate sensitivity have been punished worse than bonds with lower interest rate sensitivity. While high yield bonds have benefited from less interest rate sensitivity than government bond, the market has begun to increase the spread (over low-risk government bonds) on the interest rate for high yield bonds.
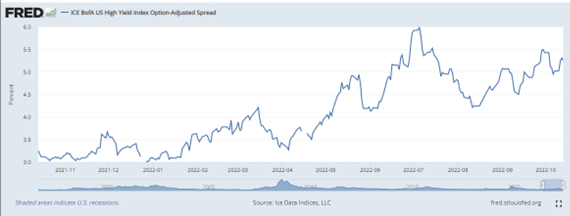
The chart below shows the interest rate spread between high yield bonds and U.S. Treasuries. As interest rates have risen, spreads on high yield bonds have slightly widened/increased. A higher interest rate spread is typically indicative of deteriorating economic conditions:
10/15/2021 – 10/13/2022
While the risk of higher defaults is starting to be priced into the market, let’s zoom out and see the magnitude of these increases in spreads compared to previous recessions and market drawdowns. Below is the same chart going back to 1996. The first gray area is the recession during the dotcom bubble/September 11. The second gray area is the increase in spreads during the financial crisis; and the third gray area is the very short but meaningful COVID recession in 2020. In all these events, we saw substantial increases in spreads. Yet, as bad as this recent period has been, the bond market still doesn’t appear to be pricing in recession-level defaults. Despite the increasing cost of capital, spreads on high yield bonds are generally in line or slightly elevated relative to average levels:
12/31/1996 – 10/13/2022
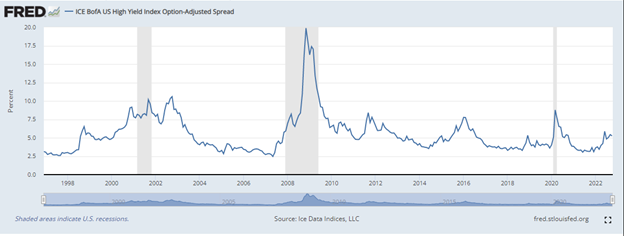
Not only are high yield bond spreads meaningfully lower than the last three recessions, but they are also lower than non-recessionary periods such as 2003, 2011 (European debt crisis), and 2016 (energy markets dislocation).
We don’t know if we will see a traditional credit cycle during which spreads increase to recessionary levels. However, we note that investors should be acutely aware of what has driven returns during this drawdown. High quality fixed income has experienced a truly historic decline while the stock market and riskier segments of the bond market have felt the pain, albeit not unprecedented at all. The market does not appear to be discounting a prolonged recession into current pricing. We believe that most of the negative returns in stocks and high yielding bonds have come from interest rate increases and not deteriorating credit conditions. If 2023 brings a recessionary environment that includes shrinking liquidity in the debt markets and lower earnings, we would expect to see further declines in stocks and high yield bonds (including higher high yield bond spreads) but would anticipate that high quality bonds such as Treasuries would hold up relatively well.
2022 has been an extraordinary year. While prices have dropped for stocks, bonds, and high yield bonds, it should be noted that most of these declines are mostly due to higher interest rates rather than a deteriorating economic landscape.
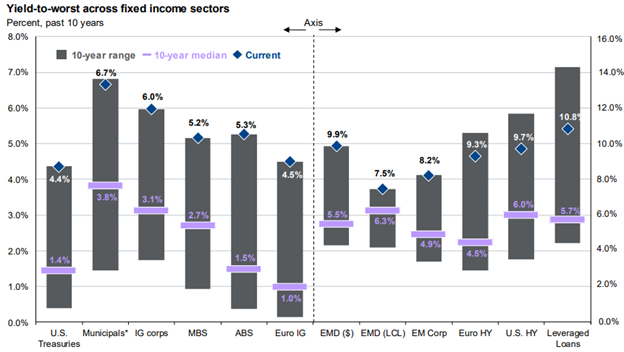
While this has been a very painful year for investors, there is a silver lining. With pain comes the prospect for higher expected returns over the long-term. Fixed income investors across nearly all fixed income market segments are experiencing the highest yield they have received in more than ten years. For high quality bonds, starting yields tend to be predictive of future returns while less risky bonds tend to see lower returns than starting yields due to defaults:
The silver lining holds true, although to a lesser extent, for stocks as well. The overall stock market started 2022 with very elevated valuations relative to history. This means that forward expected returns were likely very low for the next decade relative to historical returns. With the recent decline in stocks, we believe forward expected returns have increased as stock market valuations have begun to approach a more normalized level.
While we have no predictive power over the short run, we expect that long-term investors (10-year or longer time horizon) should anticipate higher expected returns in both stocks and bonds than just ten months ago. For more tactical, shorter time horizon investors, we believe high quality bonds may pose a more compelling risk-adjusted return opportunity than stocks.
High Yield Bond Spread Disclosures:
The information provided is for educational and informational purposes only and does not constitute investment advice and it should not be relied on as such. It should not be considered a solicitation to buy or an offer to sell a security. It does not take into account any investor’s particular investment objectives, strategies, tax status or investment horizon. You should consult your attorney or tax advisor. The views expressed in this commentary are subject to change based on market and other conditions. These documents may contain certain statements that may be deemed forward looking statements. Please note that any such statements are not guarantees of any future performance and actual results or developments may differ materially from those projected. Any projections, market outlooks, or estimates are based upon certain assumptions and should not be construed as indicative of actual events that will occur. For additional information, please visit: https://verumpartnership.com/disclosures/
All information has been obtained from sources believed to be reliable, but its accuracy is not guaranteed. There is no representation or warranty as to the current accuracy, reliability, or completeness of, nor liability for, decisions based on such information, and it should not be relied on as such.
Be the First to Know
Sign up for our newsletter to receive a curated round-up of financial news, thoughtful perspectives, and updates.
"*" indicates required fields